Linear Regression
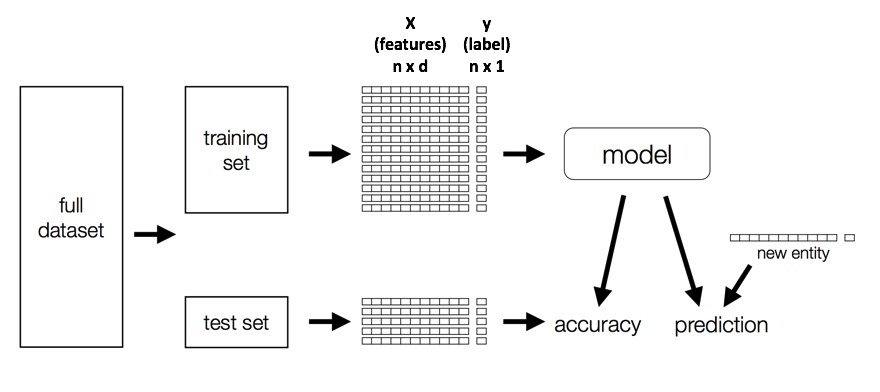
How to build/evaluate models?
Build a Model
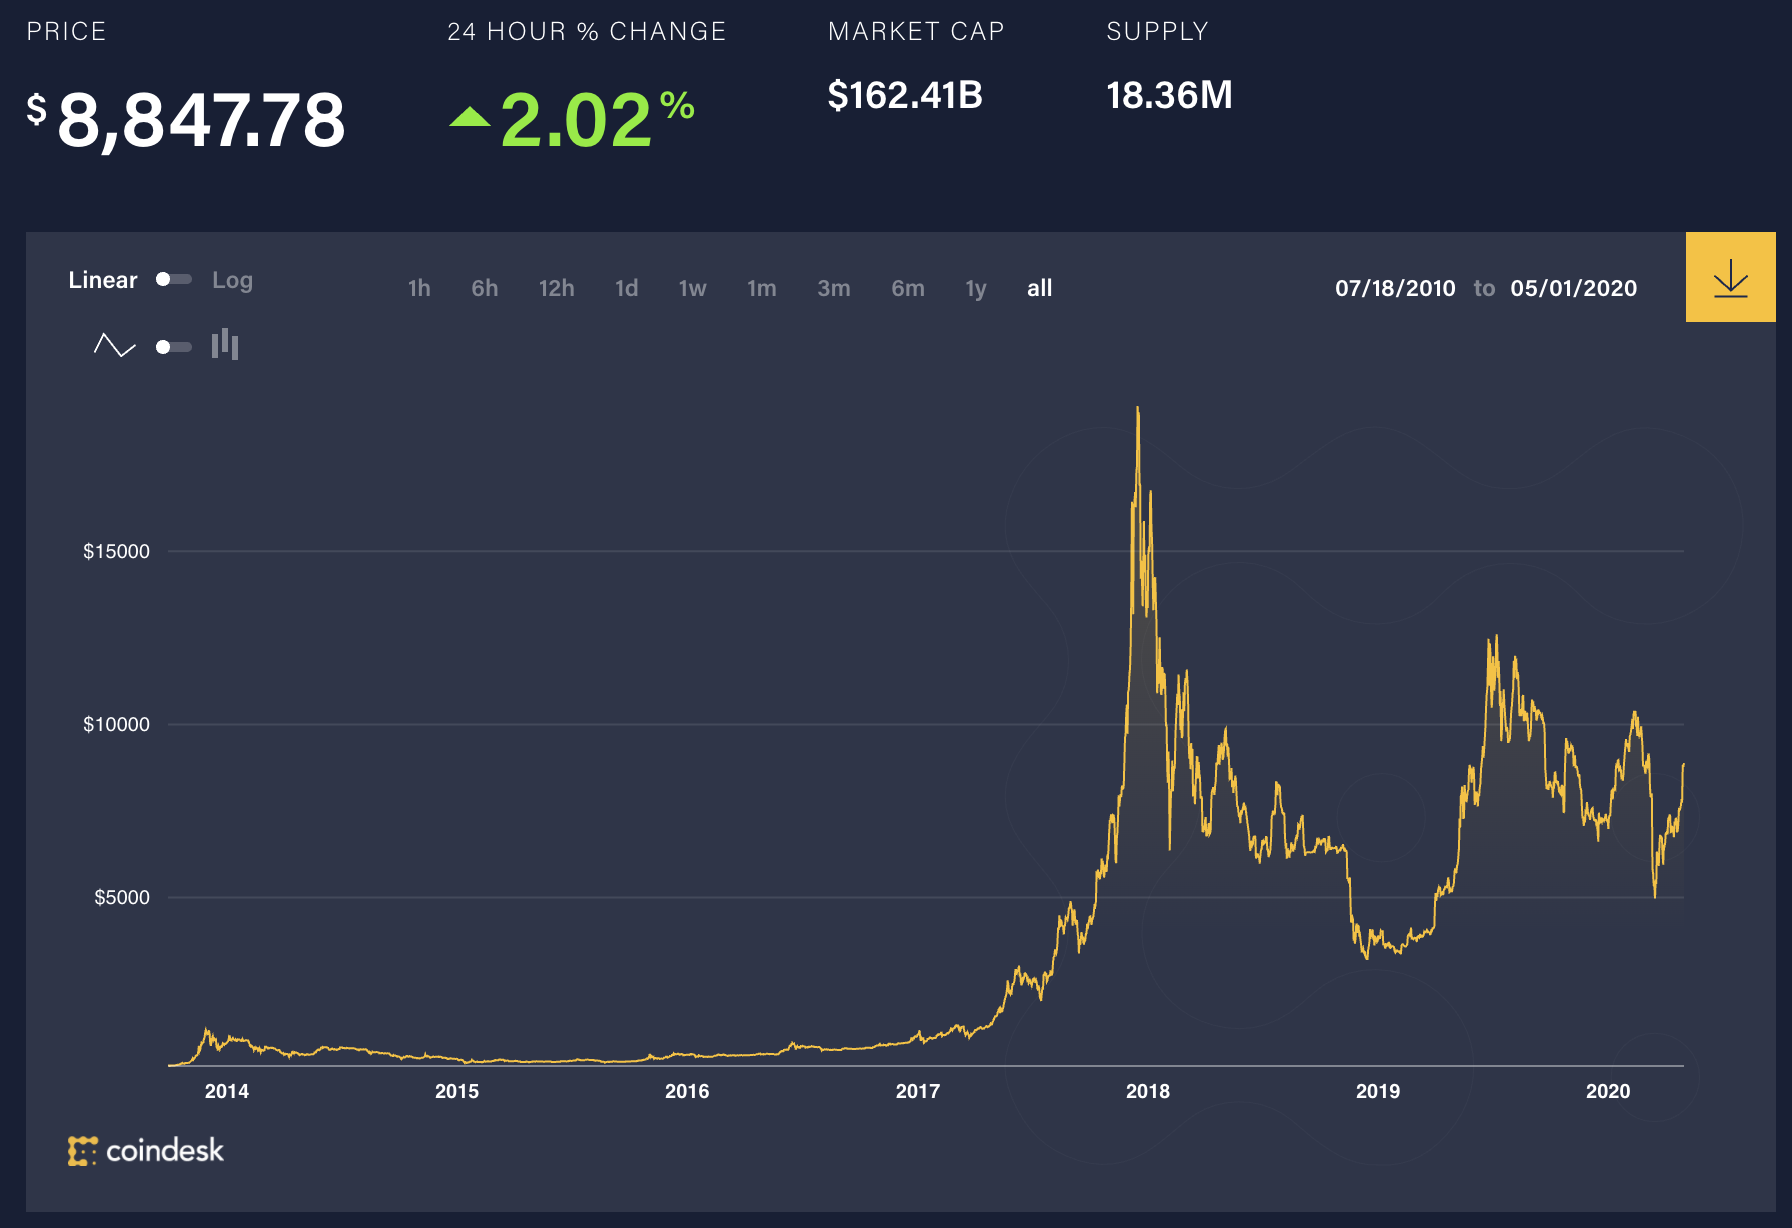
Temporal Data
Linear Regression
Goal: Find line of best fit
$\hat{y} = w_{0} + w_{1}x$
y $\approx \hat{y} + \epsilon$
x: feature
y: label
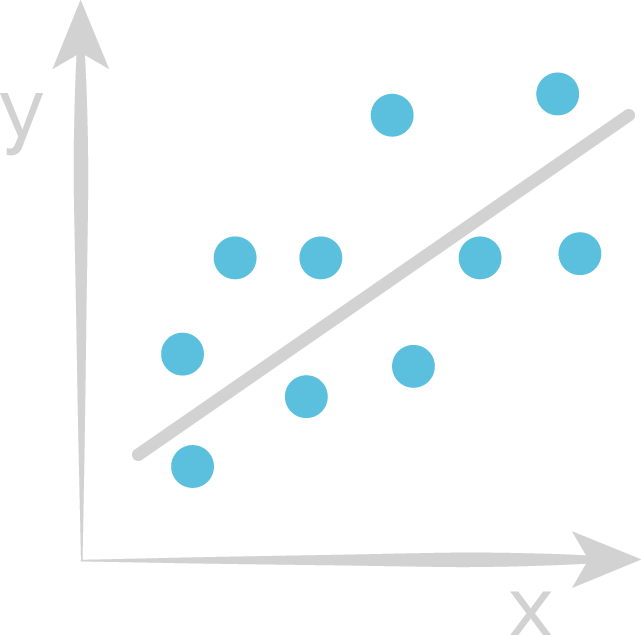
Learn weights that minimize the residuals
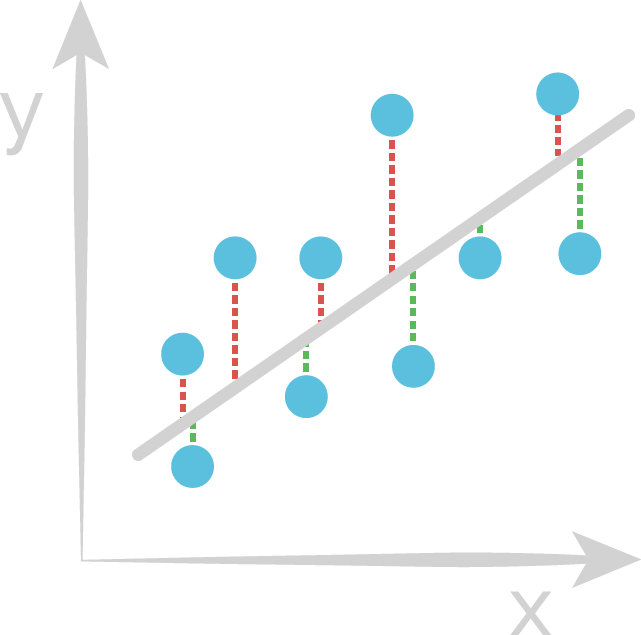
- Blue point: True value
- Red line: Positive residual
- Green line: Negative residual
Regression Evaluator
Measure "closeness" between label and prediction
Evaluation metrics:
- Loss: $(y - \hat{y})$
- Absolute loss: $|y - \hat{y}|$
- Squared loss: $(y - \hat{y})^2$
Evaluation metric: RMSE
$Error = (y_{i} - \hat{y_{i}})$
$SE = (y_{i} - \hat{y_{i}})^2$
$SSE = \sum_{i=1}^n (y_{i} - \hat{y_{i}})^2$
$MSE = \frac{1}{n}\sum_{i=1}^n (y_{i} - \hat{y_{i}})^2$
$RMSE = \sqrt{\frac{1}{n}\sum_{i=1}^n (y_{i} - \hat{y_{i}})^2}$
Train vs. Test RMSE
Which is more important? Why?
R2
Another measurement of "goodness of fit"
$SS_{\text{tot}}=\sum_{i=1}^n(y_{i}-{\bar {y}})^{2}$
$SS_{\text{res}}=\sum_{i=1}^n(y_{i}-\hat{y_{i}})^{2}$
$R^{2} = 1-{SS_{\rm {res}} \over SS_{\rm {tot}}}$
What is the range of R2?
Machine Learning Libraries
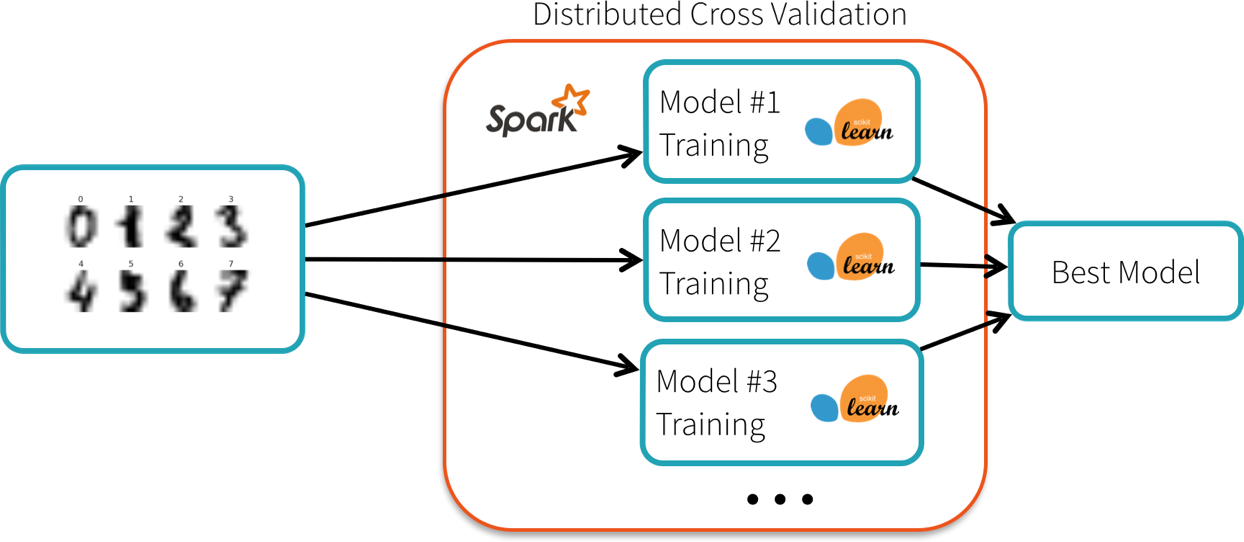
Can train multiple scikit-learn models in parallel with Joblib or Pandas UDFs, but what if our data or model get big...
ML Libraries in Spark
MLlib
Original Spark ML API based on RDDs
SparkML
Newer API based on DataFrames
Spark 2.0: Entered maintenance mode
Supported API moving forward
Linear Regression Lab
How to Handle Non-Numeric Features?
Categorical
- No intrinsic ordering
- e.g. Gender, Country, Occupation
Ordinal
- Relative ordering, but inconsistent spacing between categories
- e.g. Excellent, good, poor
One idea
Create single numerical feature to represent non-numeric one
Categorical features:
- Animal = {'Dog', 'Cat', 'Fish'}
- 'Dog' = 1, 'Cat' = 2, 'Fish' = 3
Implies Cats are 2x dogs!
One Hot Encoding (OHE)
Create a ‘dummy’ feature for each category
'Dog' => [1, 0, 0], 'Cat' => [0, 1, 0], 'Fish' => [0, 0, 1]
No spurious relationships!
Storage Space
Ok, so that works if we only have a few animal types, but what if we had a zoo?
Sparse Vectors
Size of vector, indices of non-zero elements, values
					DenseVector(0, 0, 0, 7, 0, 2, 0, 0, 0, 0)
					SparseVector(10, [3, 5], [7, 2])
Assumptions?
Linear relationship between X and Y
Features not correlated
Errors only in Y
